He who pays the piper

Calls the tune that kills a country

Professor Neil Ferguson.
Lead author of Imperial College Report 9 of 16 March 2020, titled Impact of non-pharmaceutical interventions (NPIs) to reduce COVID-19 mortality and healthcare demand.
Blog readers will recognise this mass-murderer, sorry Professor. The man whose 16 March report prompted Boris Johnson to declare martial law on his own people, and murder a country, with the loss of life (in progress) of hundreds of thousands of its people.
These are the figures Ferguson created for that 16 March Report:
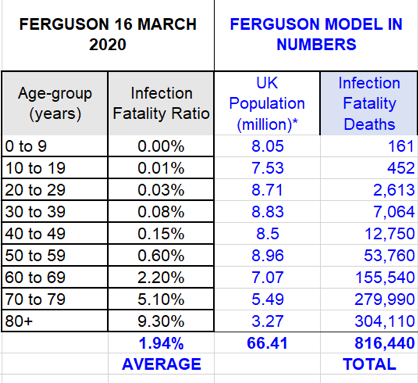
You know the reality: something around 5% of that total number.
Now, let’s be sensible. Whatever you were a professor of, if you were told that Govt UK would follow the science, you would want to be very sure of your science, wouldn’t you?
I mean, if you were aware that you would be shepherded with your report into Downing Street on 17 March 2020 (see Worlds Ends), you would need to be able to convince those in power whom you were addressing of the compelling certainty of your information.
Unless you’re Professor Neil Ferguson. For those who are reading Worlds End, you already know the narrative of what really happened in March 2020.
In this wired world, there are always more maggots to come crawling out of the rotten apple. And here, in his own words, is Ferguson in interview. The interview was recorded sometime before 15 February 2020. That is one month before the infamous Report 9.
That’s the Report which relied upon exactly the same Wuhan information as is discussed in this interview. In fact, the footnote to that infamous table references the February paper on the Wuhan outbreak, and states that this is where the epidemiological data is drawn from.
The full interview is below.
What Ferguson, with his interesting speech impediment, has to say is:
“that gives us an estimate more like of the order of 1 percent of people infected with this virus might die, with an enormous amount of uncertainty probably four fold in each direction so anywhere from about a quarter of a percent which is comparable with pandemic influenza viruses, 1968 and 1957 pandemics all the way up to 4% which would be more comparable with the 1918 Spanish flu epidemic”
This is by reference to the exact same data which Ferguson supposedly relied upon to create his fantasy death table,.
Wuhan data:
February Interpretation: 0.25% to 4%. With a big “don’t really know” sticker.
March Interpretation: We are sure its 5% to 9.3% for the over 70’s population.
The reality turned out to be 0.25% to 0.4%: depending on how you classify death certificates (see Worlds Ends Chapter 6).
You might find even more extraordinary this admission:
“I don’t think the estimates at the moment at the level where we can be using them for predicating you know this many of people will die in the UK for instance or in any other country”
Do we really for a moment believe that this is what he was saying, while sipping from the cup of power, at Downing Street on 17 March 2020?
Can this statement of scientific prediction precision:
“How many people might we expect to die in a county like the UK for instance? ‘Cos just knowing what proportion of people are being infected die, doesn’t tell you the overall impact on health mortality unless you know how many people you might expect to be infected overall”
have been such as to panic a Prime Minister into killing his own country?
Finally, appreciate the quality of the scientific mind which can articulate data of death with such clarity:
“We don’t have precise estimates of the attack rate at the moment but we can go on the basis of past pandemics of respiratory disease and really the best example there is influenza and we know influenza pandemics, it varies, probably cause about somewhere between 25% and 40% of the population to become sick in the first year, but some, a lot of those people have really quite mild disease and then there’s a hidden what we never see is there’s you know something like another 20% 30% of the population get infected but really are not showing any symptoms, that gives a complete attack rate percentage of the population can vary depending on the pandemic but a 60% might be a central estimate for the first year of people who proportion of the population get exposed to the virus becoming, even some of which develop symptoms and that’s the number then you multiply by the most broad definition of the case of fatality ratio the one where you’re looking at what proportion of everybody gets infected will die.”
In case you missed it, on his own stumbling, bumbling analysis, Ferguson’s table should have considered only 60% of the UK population. Then deducted 30%. Which would have got you to: oh yes, the very numbers set out in the Govt UK SARS-Covid Pandemic Plan of 2011, as re-issued on 3 March 2020 (see Worlds Ends, Chapter 3).
But when a Plan does not call for a lockdown, indeed insists that the primary principle is to Keep Britain Open at all costs, what do you do if you want to justify the opposite?
Pay the Piper to fabricate a new tune.
You might also discern a haunting answer to another question from this candid, relaxed interview. Was Ferguson hired to present apocalyptic fantasy because he is a Julius Caesar of epidemiology? Or because he’s a Claudius. Watch his tongue-tied, slathering performance, and decide for yourself.

Update on COVID-19 outbreak with Professor Neil Ferguson
Published – 15 February 2020
Uploaded March 2020.
“Interviewer: I will now speak with Professor Neil Ferguson, director of J Idea to give us an update on the current status of the novel coronavirus outbreak.
PNF: I mean the epidemic is continuing to spread internationally with more cases outside China being reported every day. Some notable ones like the cruise ship in Japan, giving us also an indication on how rapidly the disease spreads from person to person. In China, at the epicentre, Wuhan City, case numbers appear to be plateauing to be sure. It’s in line with predictions that the epidemic would peak in the next week or two at least. Very difficult to know what’s really going on in China because they are using a case definition such that they only test people with really travel history to Wuhan by province and so there are anecdotal reports of large surges in pneumonia cases in multiple cities across China. Those are currently not reflected in official case numbers. We would expect the epidemic to be progressing in China from the current data.
Interviewer: What can we say about the severity of the coronavirus?
PNF: I mean the team here has been working hard for the last two to three weeks on trying to say something about really the range of clinical symptoms in particular the thing we’re most concerned about you know what proportion of people infected with this virus might die. It’s a challenging question to answer because depending on where you look, surveillance systems, hospitals medical systems are picking up different ranges of severity. We think in China really it’s only the most severe cases who are being tested for the virus and so based on a variety of data sources, official case reports, and then early case data from China we estimate something of the order of 18 percent of cases in certainly the epicentre, Wuhan, may die. That’s not to say 18% of everybody infected with the virus in Wuhan will die, we think separately that perhaps only 5% of cases are actually being tested in that city. So we’re seeing a kind of server tip of the iceberg and hence we get relatively high estimates of the proportion of those cases who might die.
Another group we can look is the case of senior travellers and there we also have very little data to go on, we’ve only had two deaths and well over 290 travellers diagnosed so far. That brings us to another challenge with doing the sort of calculation that there’s a long delay from when somebody’s diagnosed typically with this virus and where most people, if they are going to die, will die, something like three weeks we think in data in China, and that’s consistent with what we know from SARS 20 years ago for these sorts of viruses.
And so when we look at deaths today we might superficially have been reassured somewhat that we’ve only seen 2 deaths, 290 reported cases but really the deaths we see so far need to be compared with where the cases numbers were for instance about two weeks ago. Of course with an exponentially growing epidemic, there’s many fewer and so our estimates in that travel population, I mean there’s a lot of uncertainty but the central estimates are between 2% and 5% roughly. Even that though doesn’t really tells us the number we want to know which is in the large epidemic what proportion of people infected might die and the reason it doesn’t is that there’s been a lot of focus clearly on travellers coming into countries, with apparent signs of illness. The surveillance wouldn’t have picked everybody up, some people would have made a very mild disease, some people infected may not show any symptoms at all. So to get to that last number we need an estimate of really what’s the true number of people infected. The only data we have on that is actually from the flights which where a number of countries repatriated their citizens back to, for instance, Germany and Japan and they swabbed everybody on those planes, a nasal swab and tested it for virus, and so that gives us a measure of what is called infection prevalence, what proportion of people are infected irrespective of whether they have symptoms or not. And we can go back and say well if those people where representative of everybody in Wuhan, now what does that imply about the size of the epidemic there. And what that tells us, that calculation is really that the epidemic is, is overall three times large than it would be even allowing for the travellers. Basically countries around the world are probably detecting only one in three, one in four of the infected people coming into those countries.
That seems like bad news in one respect, it’s good news in the sense of it gives another way of you know putting the reported deaths in cases in travellers into perspective and you have to divide that crude number of between 2% and 5% mortality by that level of underreporting. Assuming the deaths are more likely to be detected that gives us an estimate more like of the order of 1 percent of people infected with this virus might die, with an enormous amount of uncertainty probably four fold in each direction so anywhere from about a quarter of a percent which is comparable with pandemic influenza viruses, 1968 and 1957 pandemics all the way up to 4% which would be more comparable with the 1918 Spanish flu epidemic.
Interviewer: Your estimates have a large range of uncertainty how useful does it make them?
PNF: I mean I think it informs what in the UK is called what the reasonable worst-case scenario. It informs planning the kind of scale of planning countries should be prepared to undertake. If we have even a reality small risk of an epidemic with a large public health impact in terms of hospital beds occupied, severe illness and death then of course it merits correspondingly large preparedness effort and these efforts they cost money, they divert resources. So I mean it informs those decisions. I don’t think the estimates at the moment at the level where we can be using them for predicating you know this many of people will die in the UK for instance or in any other country, but they do say this is a serious threat which we need to plan for very seriously and dedicate resources to and certainly that’s what’s happening, in the UK and other counties.
How many people might we expect to die in a county like the UK for instance? ‘Cos just knowing what proportion of people are being infected die, doesn’t tell you the overall impact on health mortality unless you know how many people you might expect to be infected overall.
We don’t have precise estimates of the attack rate at the moment but we can go on the basis of past pandemics of respiratory disease and really the best example there is influenza and we know influenza pandemics, it varies, probably cause about somewhere between 25% and 40% of the population to become sick in the first year, but some, a lot of those people have really quite mild disease and then there’s a hidden what we never see is there’s you know something like another 20% 30% of the population get infected but really are not showing any symptoms, that gives a complete attack rate percentage of the population can vary depending on the pandemic but a 60% might be a central estimate for the first year of people who proportion of the population get exposed to the virus becoming, even some of which develop symptoms and that’s the number then you multiply by the most broad definition of the case of fatality ratio the one where you’re looking at what proportion of everybody gets infected will die.”